Google Sheets is a free, web-based program for creating and editing spreadsheets. If you are getting started with Google Sheets, you are in the right place. Here, we will show you the best way to use this platform to analyze your data.
The benefits of using google sheets
Using Google Sheets for marketing purposes has many advantages. Here we have listed a few of them:
It’s cloud-based
Cloud-based spreadsheets are automatically saved and stored.in a remote server. That means that you can access it online from anywhere. They are also available offline.
It is free service
Google Sheets is free for all Google account holders so you do not need to spend money on software.
It works across devices
You can access and edit Google Sheets data from a wide variety of devices such as smartphone, tablet, and computer.
Add-ons are available
These additional features makes spreadsheets more versatile and powerful than Excel.
Pivot tables
A pivot table is a table of statistics that summarizes the data of a more extensive table. are great tools whenever you have a large quantity of data. You can use them to summarize huge amounts of data and to compare similar data and figures from different perspectives. When your spreadsheet begins to grow, outlining conclusions could be more challenging. That’s where pivot tables come in. A pivot table takes a large set of data and summarizes it. They are also used to understand and to recognize patterns in a data set. In such cases, a pivot table can be a huge advantage, as it will only take few minutes to summarize groups of data. When you have a big data set, a pivot table allow you to create a report within a few minutes and save it for future analysis. It is an effective tool for building reports in a fast manner because you can sort and visualize the data quickly.
The spreadsheet contains data with a vast amount of information. A pivot table will help you to compare and analyze that information. You can easily rearrange the table so you only look at what matters to you.
Whether you are using a Mac or a PC, you can select the whole dataset that you want to look at and select: “Data” -> “Pivot Table”. Once you have your table in front of you, you can drag and drop the Column Labels, Row Labels, and Report Filter.
How to use Google Sheets offline
If you need to use Google Sheets offline, follow these steps:
- First, you have to be connected to the internet.
- You will also need to use the Google Chrome browser.
- Then you have to install and enable the Google Docs Offline Chrome extension and ensure you have enough free space on your device to save all your files.
- After that, you need to open Chrome and make sure you are signed in.
- Then, go to drive.google.com/drive/settings and check the box next to “Sync Google Docs, Sheets, Slides & Drawings files to this computer so that you can edit offline.”
- To work offline from a computer, you need to install Backup and Sync.

Google Sheets can be very helpful to help you make smarter, more informed decision that could drive significant results for your brand.
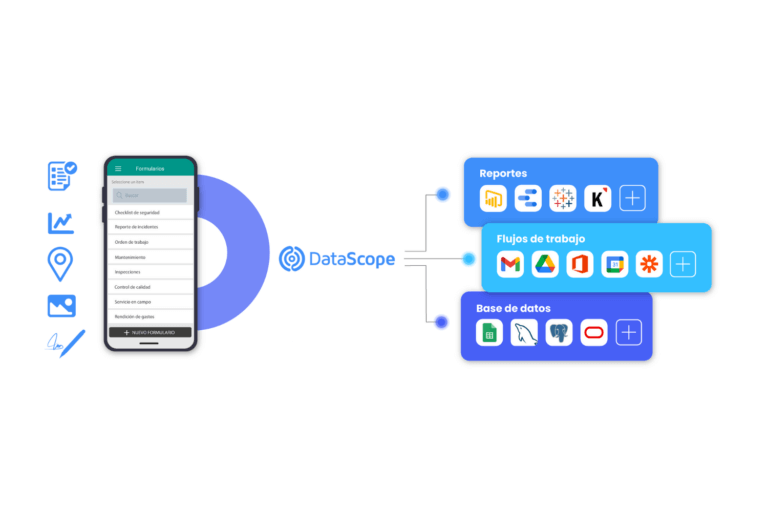
DataScope is a platform that allows various industries to streamline, organize and evaluate the work of their field staffs and can get integrate with Google Sheets and more than 1,000 Apps.
DataScope es una plataforma que permite a diversas industrias agilizar, ordenar y evaluar el trabajo en terreno, gracias a sus listas de control de inspección de limpieza y formularios en línea que proveen indicadores en tiempo real 100% adaptables a cualquier necesidad.


