You have all this collected data about your latest marketing campaign, and now you must figure out all the trends and turn them into reports. But, it takes a lot of time and energy that you don’t have. Luckily, Google comes to the rescue: Google Sheets is a free online tool that allows you to create and edit your reports. It even lets other participants collaborate while you work, so each one can do their part and make teamwork easier.
Tricks for a better experience with Google Sheets
Create a heat map with conditional formatting
A heat map is a great way to highlight relevant points and a good visual analysis. By using this technique, you can highlight cells with different colors depending on their importance (for example: green for most valuable, red for the least) or category.
To create a heat map, first, you have to select your information.
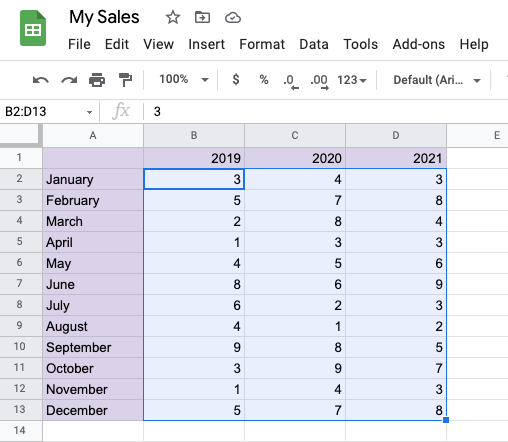
Then, click on the “Format” option above. A menu will pop up, you must tap “Conditional Formatting”.
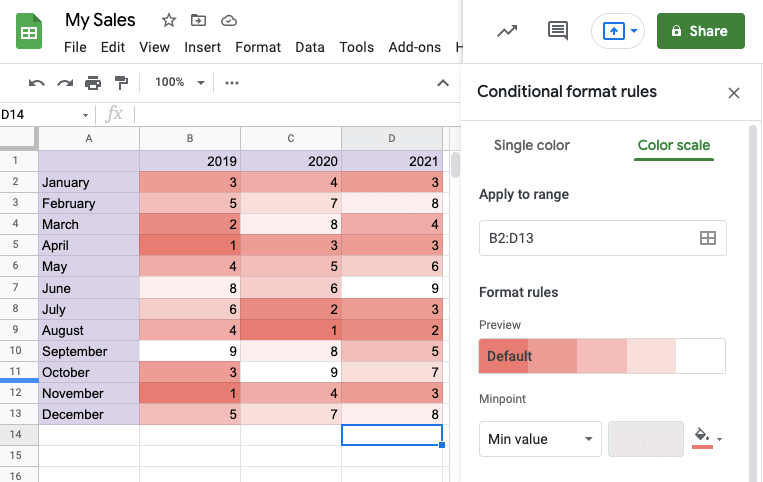
After that, you need to press on “Color Scale”, at the top of the menu. Once you do that, Google Sheets will automatically apply default colors marking the range of your selected data. If you don’t like the default colors, just tap on top of “Default” and you can change it to other alternatives.
Add images to the cell
You can also add images to your reports. There are two ways to do it:
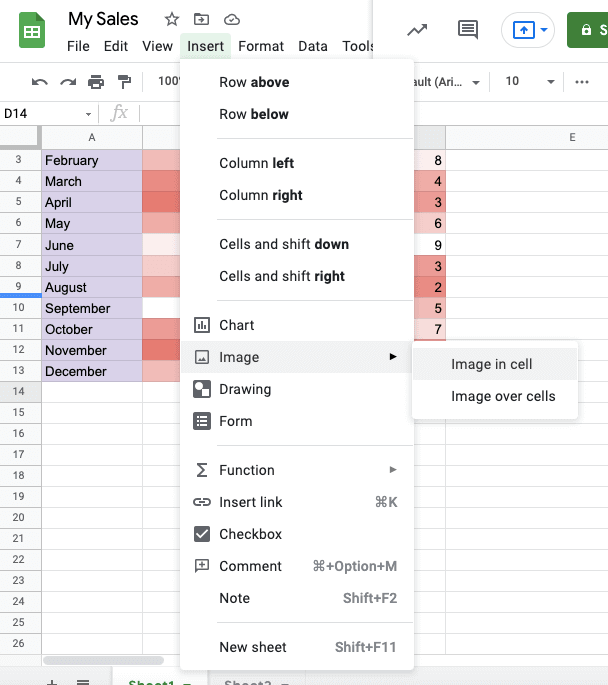
- Select “Insert” at the top menu bar, then tap “Image” and upload any picture you want from your computer. You can choose between “Image in cell” or “Image over cells”.
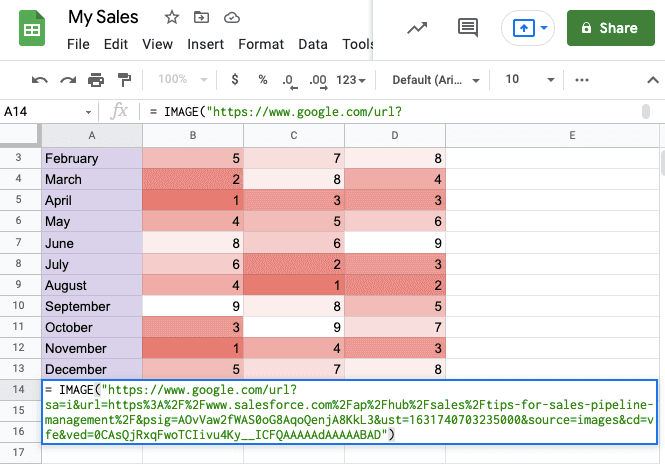
- Select the cell where you want to insert your image and type “= image”. Then, open a parenthesis and a quotation mark, followed by the URL of the image you want to place. Close up the quotation mark and parentheses, press enter, and the image will pop up.
Create data visualization
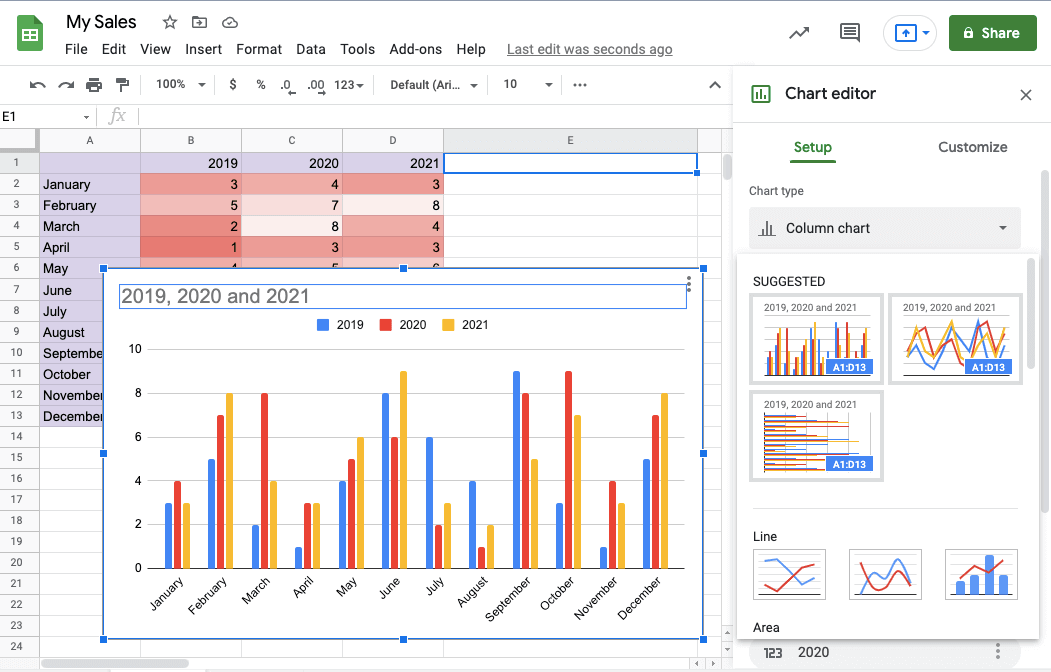
When you are done collecting all the information, you can create visualizations for your data, and it’s easier than it seems.
Select the columns and rows that you want to include in your visualization. Click insert at the top menu, then click the chart. Google Sheets will automatically give you an option chart, but you can change it by pressing “Chart Type” on the right side and select whichever looks best for you.
Set email notifications
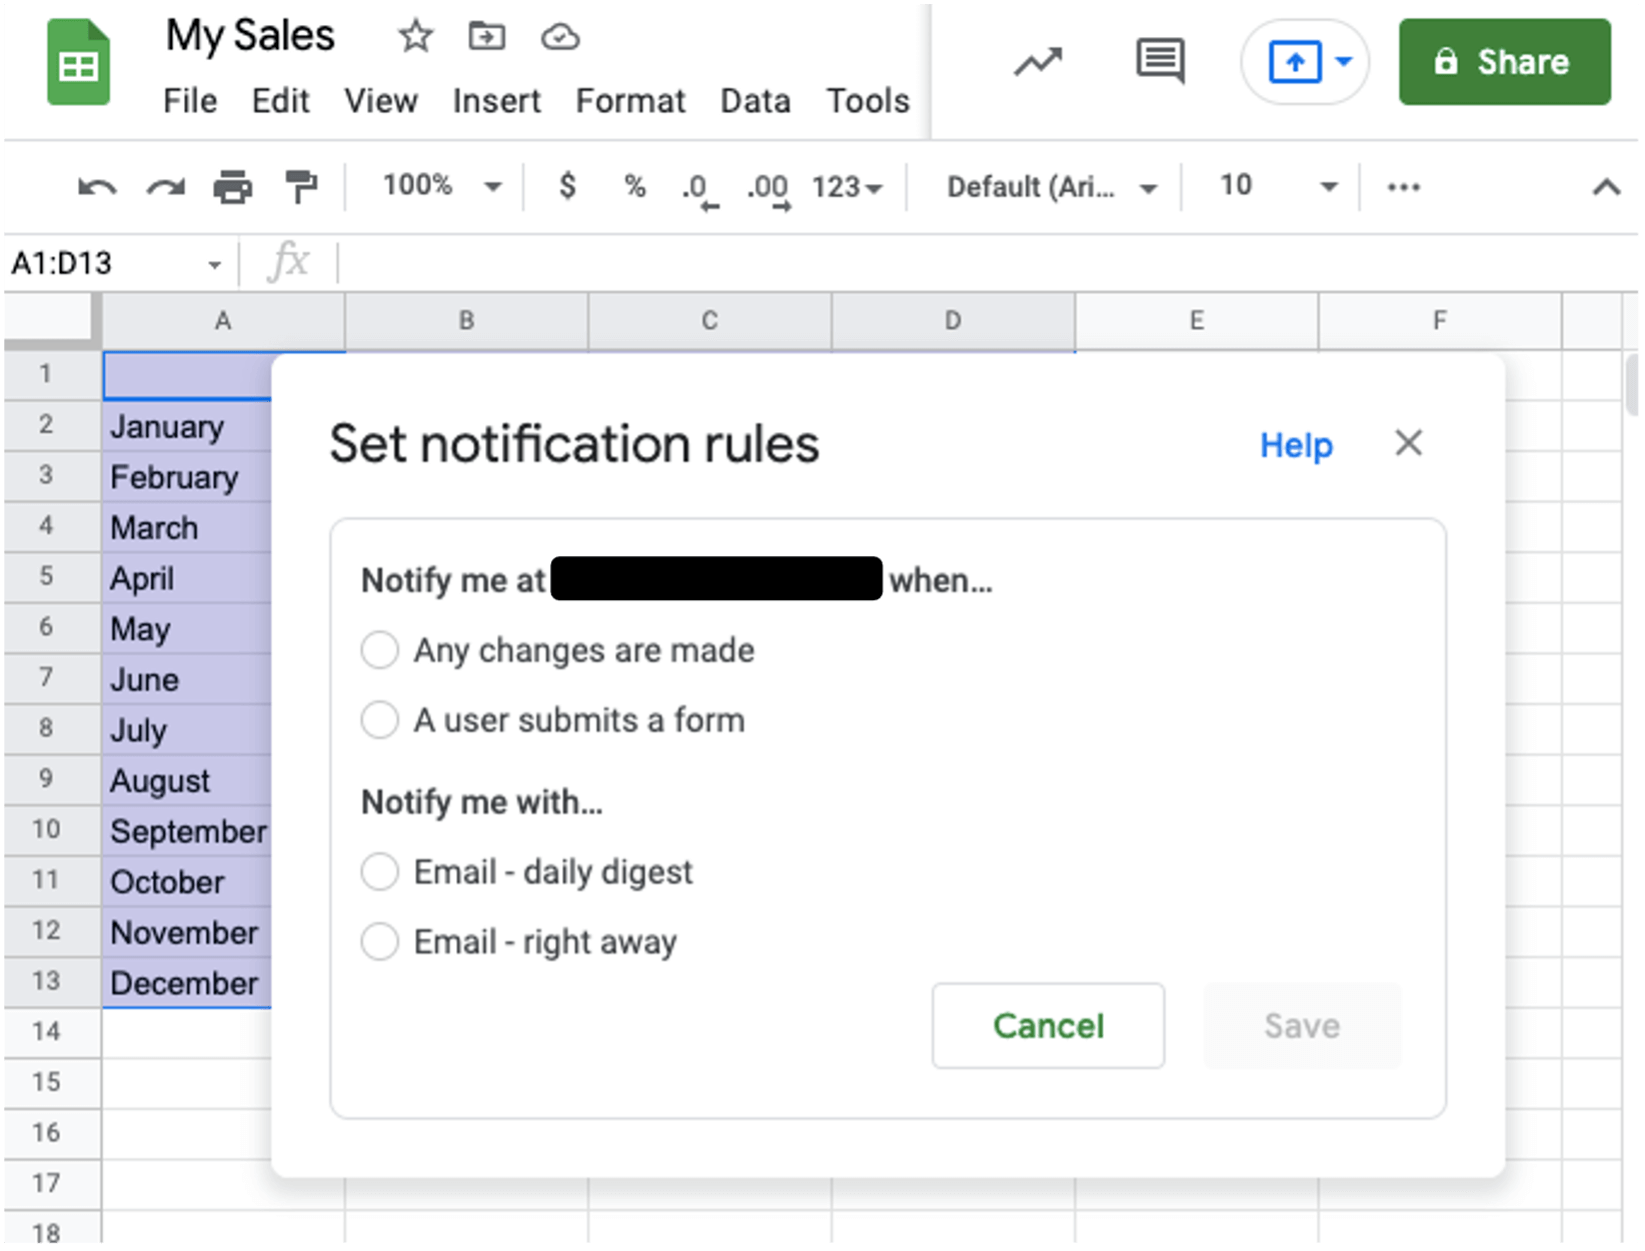
Do you want to send a report to your team or to a stakeholder? Google Sheets can help you with that.
Go to “Tools” above in the menu bar and click on “Notification Rules”. A sign will pop up asking you to set your notifications. Save the changes, and you are done!
Create QR codes
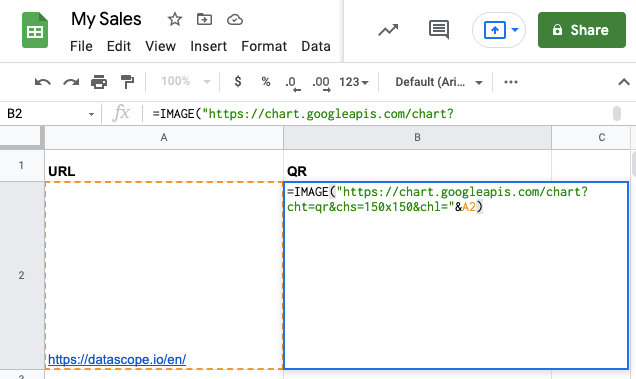
Google Sheets allows you to create your own QR codes. First, you must open up a Google Spreadsheet . Choose one column, and at the top name it “Text or URL” (A1 in this case). Choose another column next to the first one (B1) and label it “QR code”.
Type or paste the text or URL you want to access by scanning the QR code (we will use A2 for this example). Paste the same link in a cell in the other column (B2). In the B2 cell, type =IMAGE(“https://chart.googleapis.com/chart?cht=qr&chs=150×150&chl=”&A2).
Press enter, and your QR code will be created!
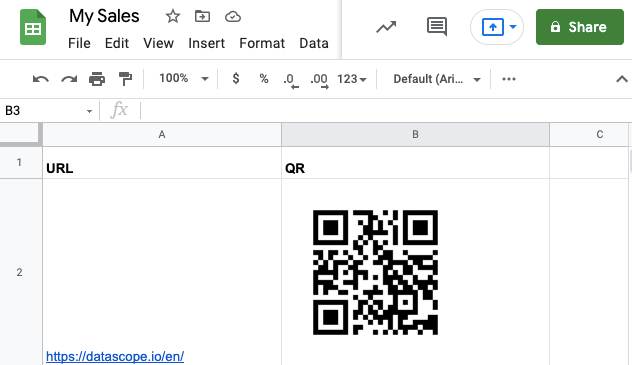
Tip: you might have to adapt your cell to the size of the image created.
Add international currencies
If your company has foreign providers or customers, knowing how to place other currencies in your reports is quite important.
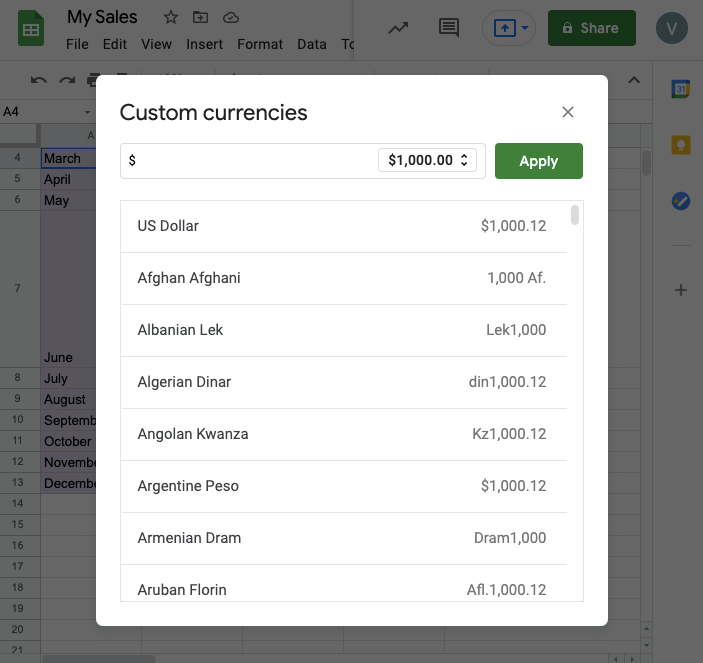
To access the massive Google Sheets coin list, you have to click on the “123” icon in the browser above. From there go to “More Formats” and to “More Currencies”. Then you have to select the type of currency you prefer from the list and click on the blue “apply” button.
Download the DataScope app now for free!
DataScope is a platform which allows various industries to streamline, organize and evaluate the work of their field staffs thanks to online forms which provide real time indicators, 100% adaptable to any field.


