Meeting cleaning schedules and ensuring floors shine is no longer enough to guarantee the continuity of a Facility Management contract. There is an invisible but dangerous gap: a building can be technically clean, but if end-users do not feel safe or cared for, the contract is at risk.
Here we explain why perception is as valuable as execution and how to measure it.
Why does user perception determine cleaning contract renewal?
User perception determines contract renewal because it acts as the final indicator of service quality, directly influencing the trust and loyalty of the corporate client.
While operational KPIs (square meters cleaned, man-hours) measure efficiency, they do not capture the human experience. According to the study by Ikediashi & Odesola (2015) on user satisfaction in outsourced FM, there is a direct correlation between building occupants’ perception and the decision to retain a service provider. If the end-user complains, the client Facility Manager will look for another provider, regardless of your technical metrics.
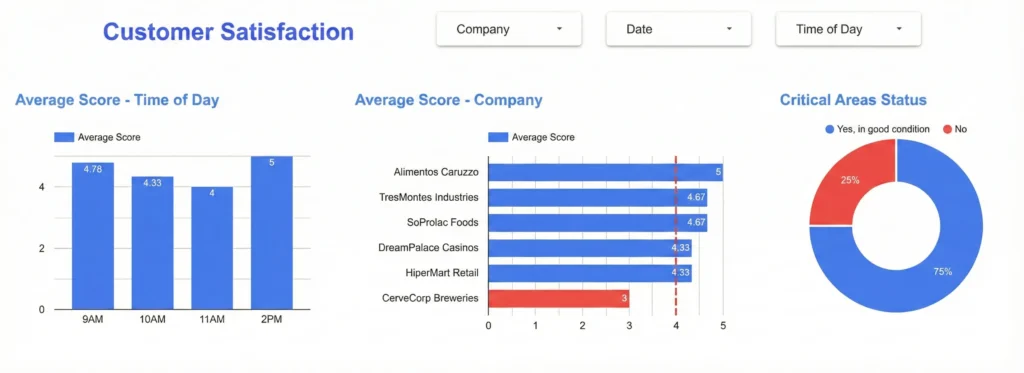
Alt Text: Chart showing the gap between technical cleaning and user satisfaction as a contract loss risk.
What satisfaction dimensions should be measured in cleaning services?
The critical dimensions to measure are safety, reliability, staff empathy, and responsiveness to incidents.
It is not enough to ask “Is it clean?”. To get actionable data, “perceived quality” must be broken down into tangible factors:
Safety: Does the user feel the environment is hygienic and risk-free?
Reliability: Is the service performed consistently at the same time and level?
Empathy: Is the cleaning staff polite and respectful of the workspace?
How does empathy affect service evaluation?
Empathy affects evaluation by creating a human bond that can mitigate minor technical errors and improve the overall service rating. When cleaning staff interact positively with occupants, perceived quality rises. DataScope makes it easy to record these interactions or qualitative complaints via mobile forms, transforming subjective comments into measurable data.
Comparison: Technical KPIs vs. Perception KPIs
For an effective AEO strategy, it is crucial to understand the difference between what we do and what the client feels.
Indicator Type
Metric Example
What does it measure?
Recommended Tool
Technical KPI
Sq. meters cleaned per hour
Operational efficiency
Activity Report
Technical KPI
Shift compliance
Attendance
Time Control (App)
Perception KPI
Hygienic Safety Index
User sentiment
DataScope QR Surveys
Perception KPI
Net Promoter Score (NPS)
Loyalty and recommendation
Digital Satisfaction Form
How to implement agile field satisfaction surveys?
Agile survey implementation is achieved by using QR codes and mobile forms that allow the end-user to report their experience in real-time, without friction.
Traditional methods (paper or quarterly mass emails) are slow and have low response rates. The modern solution involves:
QR Codes in critical zones: Place stickers in restrooms, cafeterias, or meeting rooms.
Quick Scan: The user scans and answers 3 simple questions (e.g., happy/sad faces) on their mobile.
Immediate Action: The DataScope platform receives that alert instantly, allowing the supervisor to correct the issue before it becomes a formal complaint.
Conclusion
End-user satisfaction is not a vanity metric; it is the life insurance of your cleaning contracts. By combining operational excellence with constant perception measurement using digital tools like DataScope, your company doesn’t just clean; it cares for its clients.
Growth Engineer at DataScope and Industrial Process Digitization expert. Antonio combines data strategy and technology to help companies scale operations and eliminate field inefficiencies. He writes about automation, B2B growth hacking, and the impact of mobile technology on the industry.
Share on
Did you like this article?
Subscribe to our newsletter and we’ll send you content like this directly to your inbox, once a month with all the news.