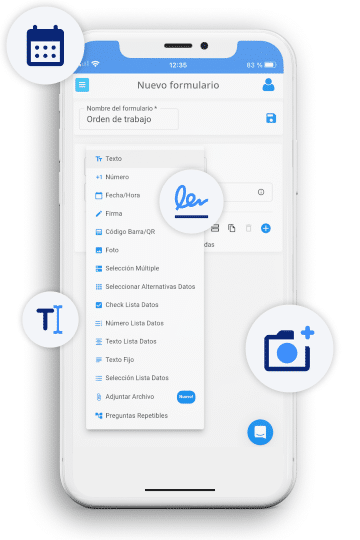
Crea formularios personalizados para cada proceso, y asegura la recopilación de datos esenciales para tus operaciones
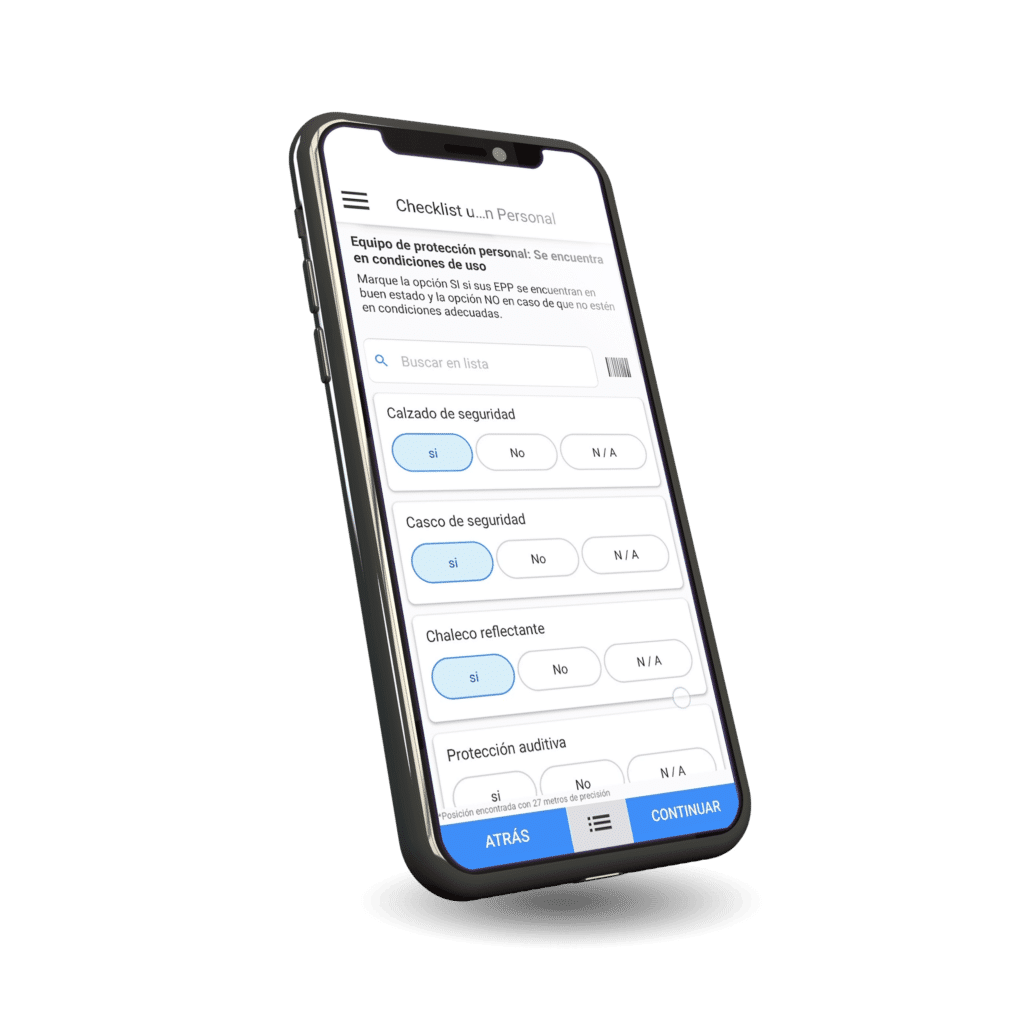
Descarga la aplicación en los celulares o tablets de todo tu equipo y recolecta datos en cualquier momento y lugar
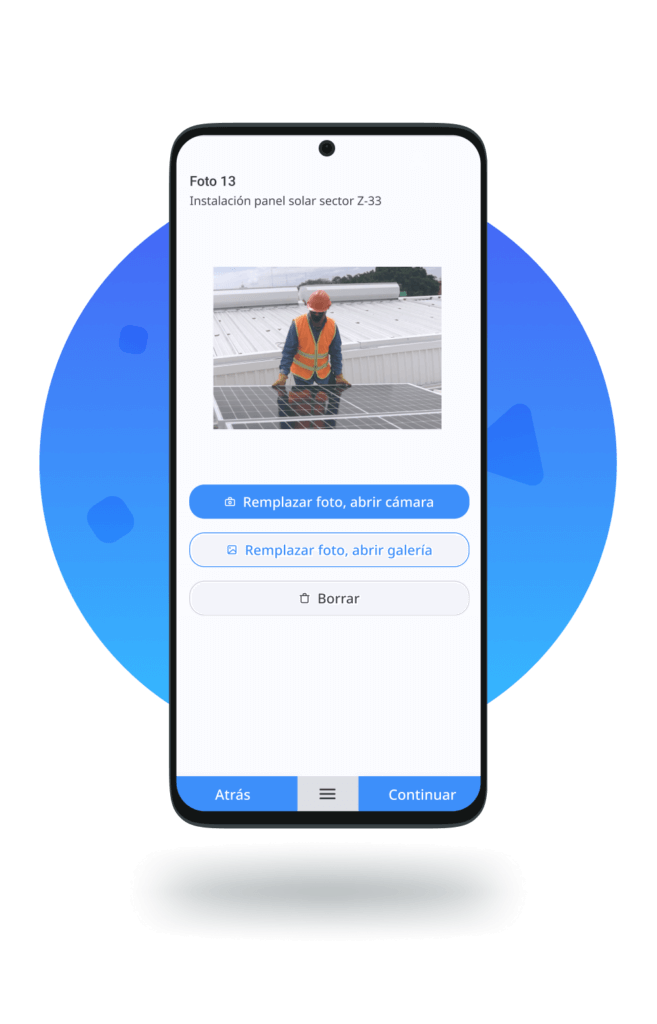
Respalda tus procedimientos con fotografías tomadas en terreno y agrégalas a tus reportes.
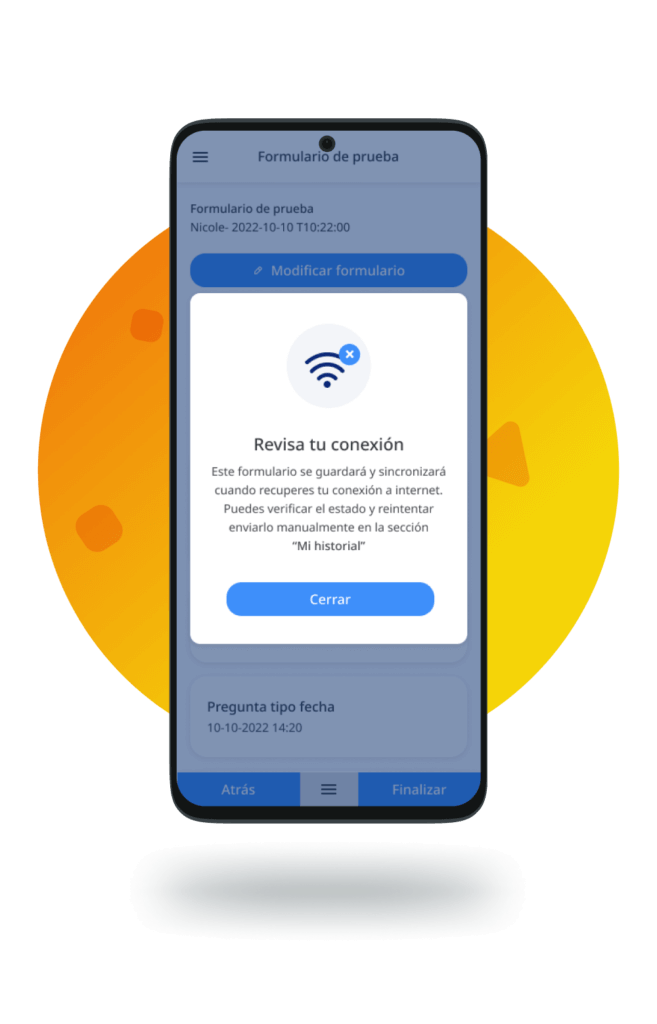
Permite que tu equipo capture datos desde cualquier lugar, aún sin señal de internet
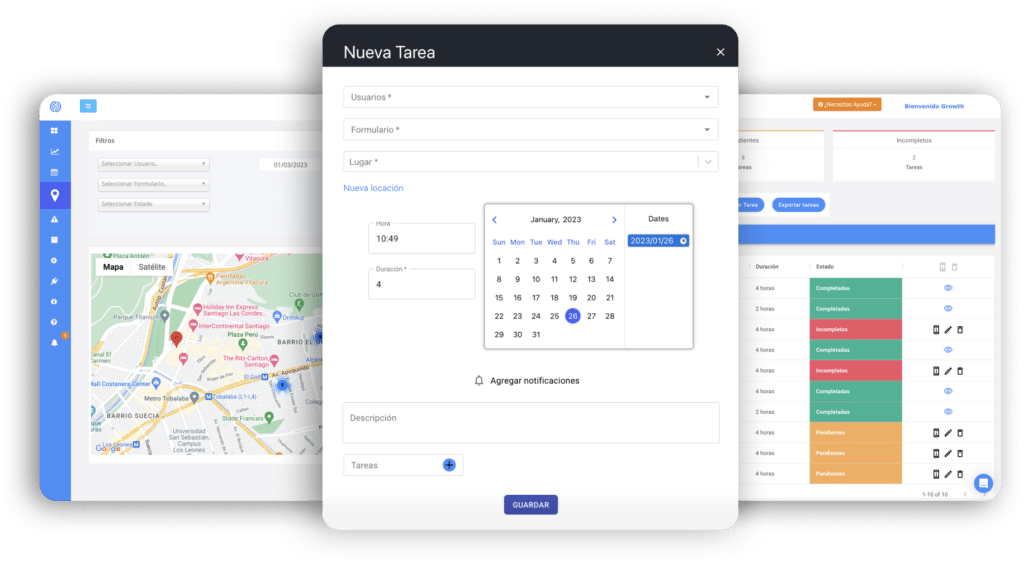
Asigna formularios y tareas a tu equipo, monitorea el estado de cumplimiento de cada una de ellas
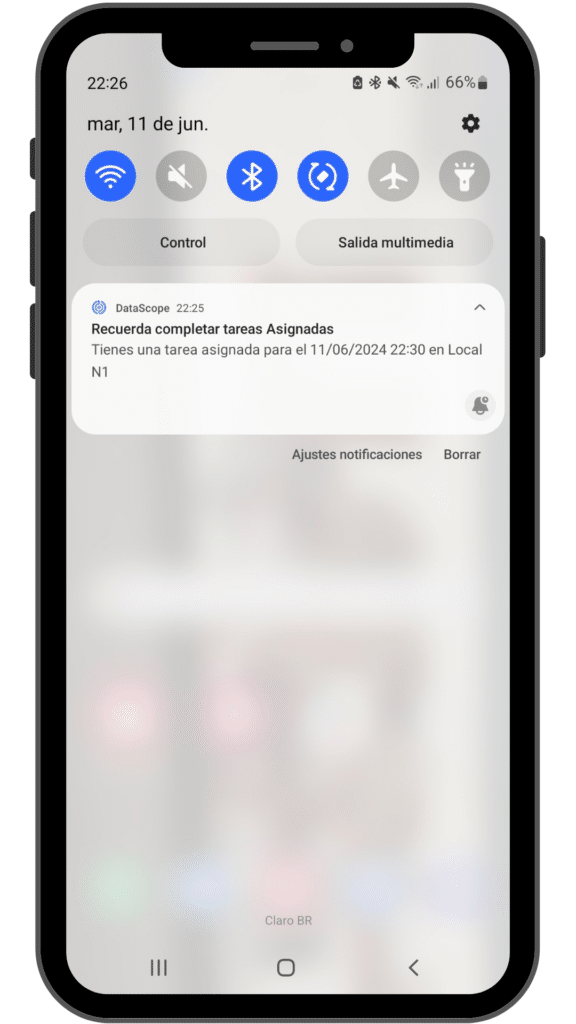
Envía notificaciones y recordatorios a tu equipo en terreno para el cumplimiento oportuno de tareas
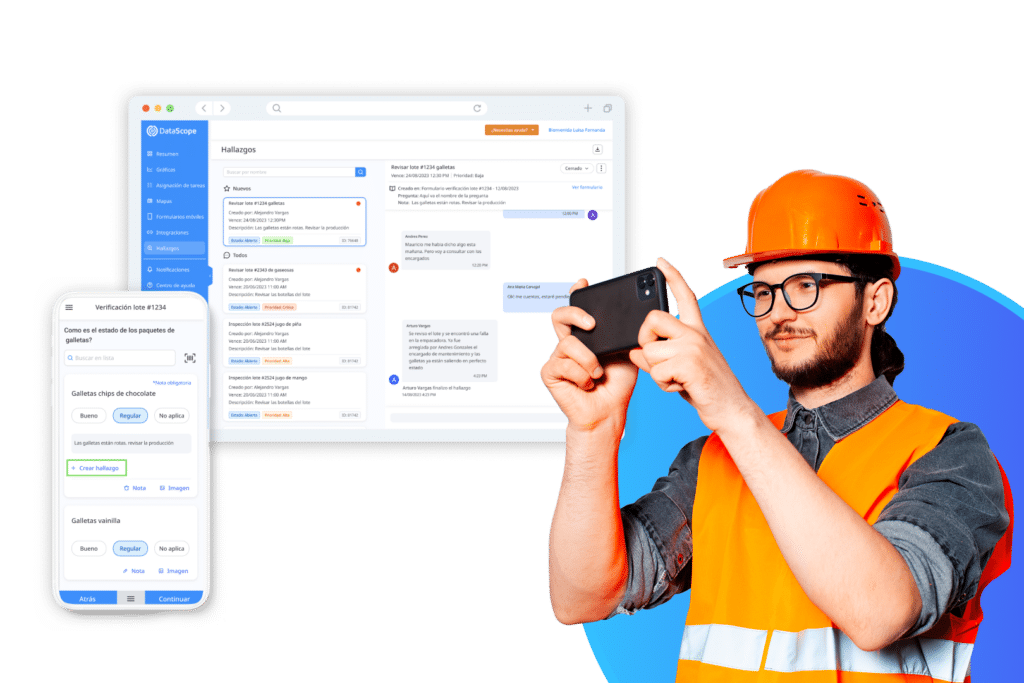
Gestiona las no conformidades reportadas por tu equipo. Asigna responsables y resuelve problemas
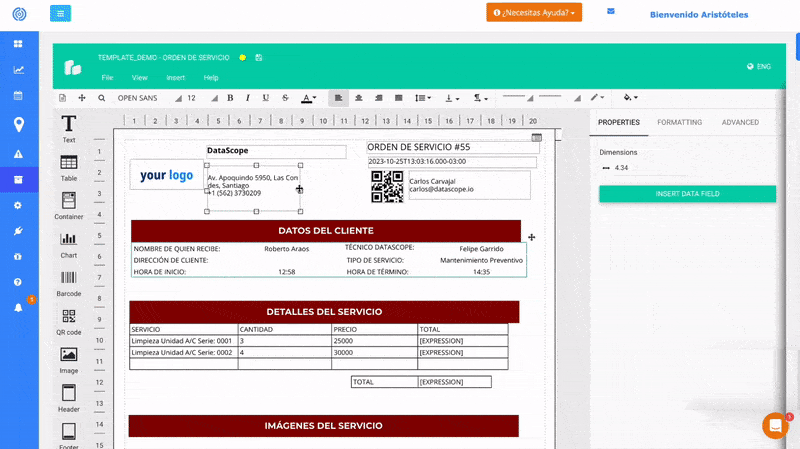
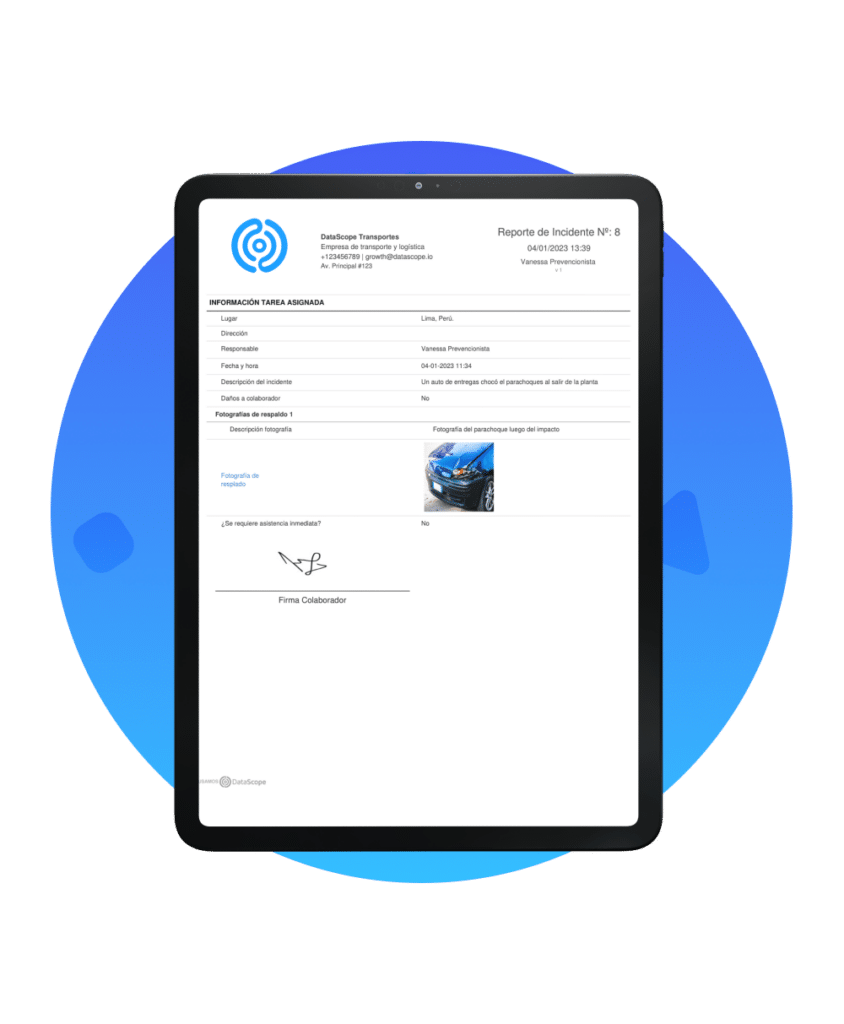
Diseña PDF’s personalizados y crea reportes específicos para cada uno de tus procesos
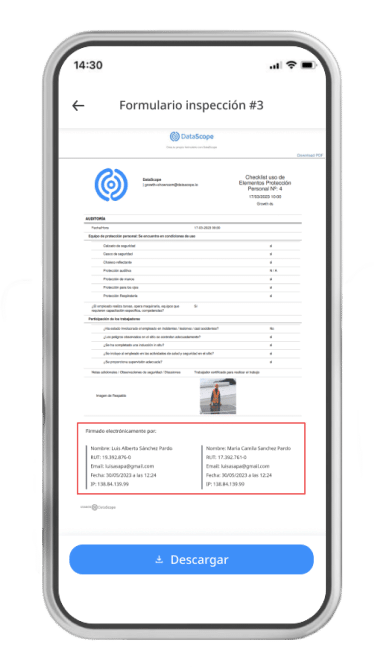
Firma documentos de forma electrónica, y asegura procesos y auditorías
*Firma validada por la Dirección del Trabajo (Chile)
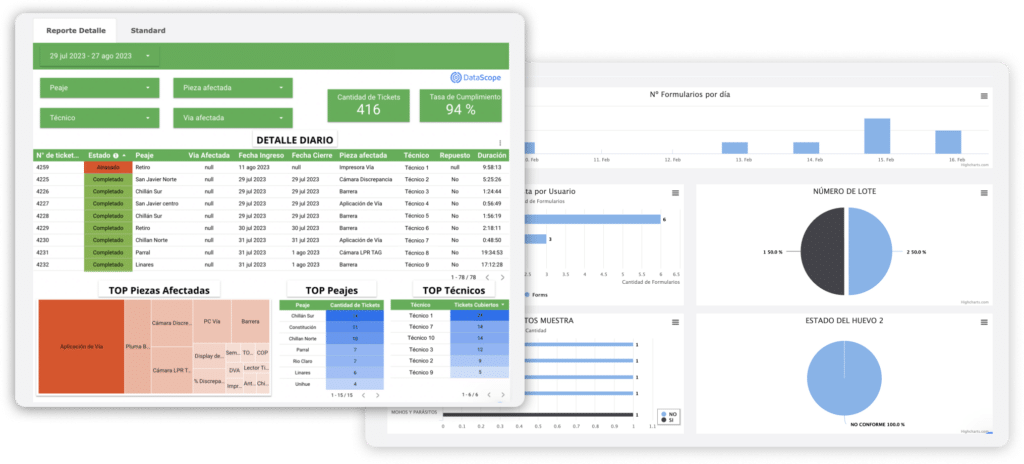
Visualiza todos los datos de tu organización en dashboards avanzados e intégralos a tu cuenta de DataScope
Envía informes de forma automática a las diferentes áreas involucradas en cada proceso
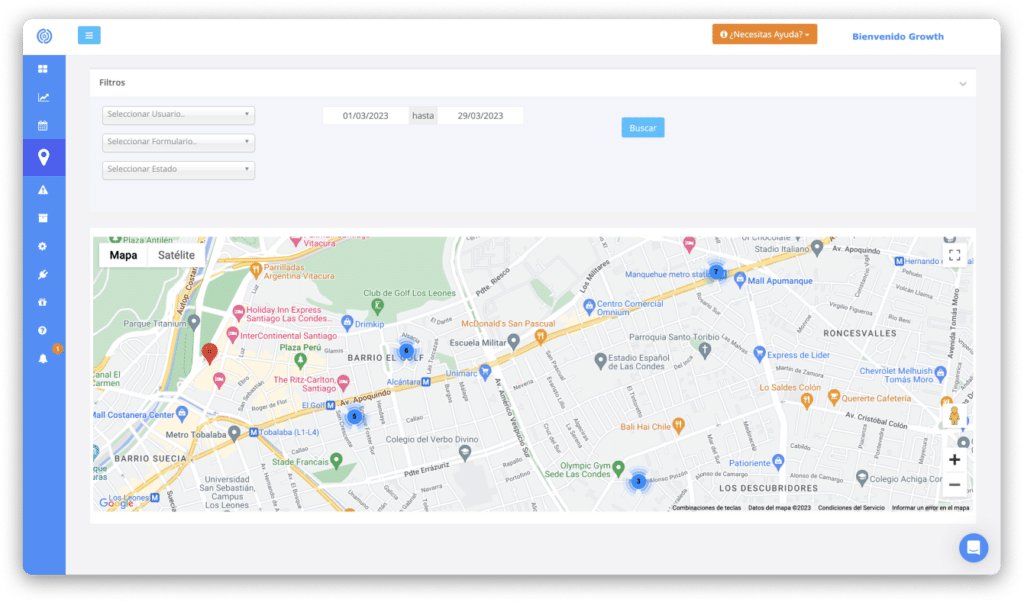
Conoce la ubicación en que fue completado cada formulario y obtén trazabilidad de las rutas de trabajo
Permite conectar los datos alojados en DataScope con más de 5,000 plataformas y aplicaciones externas
Permite leer y modificar datos de la plataforma por medio requests POST y GET usando el protocolo HTTPS con contenido JSON
Conecta todos todos lo datos recolectados por DataScope con Power BI, analízalos y toma mejores decisiones
Envía todos los datos recolectados por DataScope a Looker y crea gráficas personalizadas de tus operaciones
Integra tus formularios de Google Forms a DataScope de forma automática y poténcialos con sus funcionalidades
Permiten suscribirse para recibir información de nuevos formularios enviados o modificaciones realizadas en la plataforma
Visualiza tus datos en Google Sheets o crea flujos con las herramientas Google WorkSpace
Crea tu cuenta gratuita y personalízala en minutos.
Recolecta los datos utilizando nuestra app, incluso si no cuentas con internet.
En nuestro Portal Web podrás visualizar, gestionar y exportar los datos.